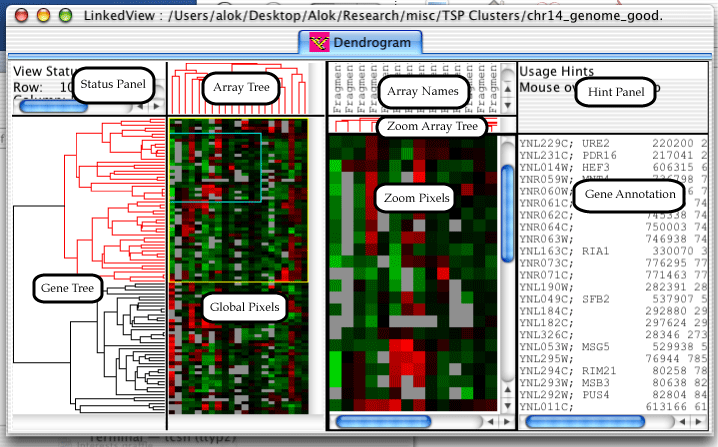
The Dendrogram is one of three views which can be created in the LinkedView application. It is also the bulk of the TreeView application. The dendrogram has a lot of components, so I've gone ahead and given them names, so that the description of the features will not be confusing.
The status panel displays different information depending upon which component the mouse is over. The hint panel displays hints on how to use the component.
Genes can be selected in the dendrogram by either clicking and dragging on the global pixels or by clicking on a node in the gene or array trees. A zoomed in view of the selected genes will appear in the Zoom Pixels pane, a yellow rectangle will appear on the global view indicating which genes are selected, and a blue rectangle will appear inside the yellow rectangle indicating which genes are currently visible in the Zoom Pixels pane.
Holding down the shift key while dragging on the global pixels will cause the exact range of arrays to be selected; by default all arrays are selected. Once a range is selected, pressing the arrow keys moves the selected rectangle around. Holding down the control key while pressing the arrow keys will grow and shrink the selected rectangle.
Clicking on a node in the array or gene trees will select all descendants of the node. The selected node and descendants will be colored in red. At this point, pressing the arrow keys will change which genes are selected. Up will select the parent of the current node, left and right will select the left and right children, and down will select the child with more descendants.
Provided the url link settings (described in the section called “Url Settings”) are set appropriately, clicking on a gene annotation or an array name will cause a browser window to open with details on the gene or array.
To add color to gene names, you must add a column named "FGCOLOR" before the GWEIGHT column. Don't have a GWEIGHT column? Well, you need to add that immediately before your first array column. For each gene, you need to specify a the section called “ Hex Codes for Name Coloring ” for the color you want that gene's name to appear in. Clearly, it is a good idea to write some kind of excel function which computes it for you, or a perl script or something.
To add color to array names, you must add a row named "FGCOLOR" before the EWEIGHT row. If you don't have an "EWEIGHT" row, you must it immediately before your first row of gene expression data. For each column in the EWEIGHT row, you must specify a the section called “ Hex Codes for Name Coloring ” for the color you want that array's name to appear in.
Hex color codes are commonly used in html documents to specify colors. The format is as follows: #RRGGBB. The RR value is a hex number between 00 and FF which specifies how much red you want. In other words,
- #FF0000 is pure, bright red
- #00FF00 is pure, bright green
- #0000FF is pure, bright blue
You can of course mix values, and use lower values than FF for less intense colors. you can either find colors by trial and error, or do a quick web search for hex color codes. It is recommended that you edit the cdt file in excel or write a perl script to add the color codes easily.
