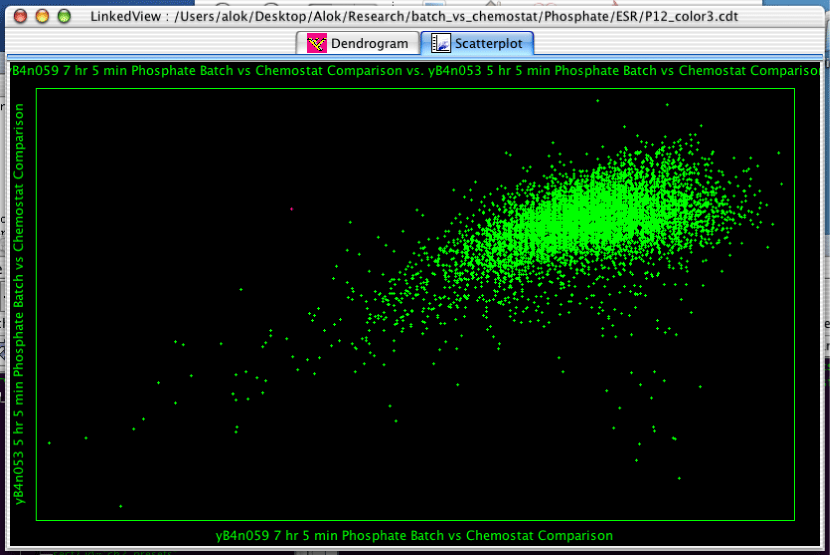
The Scatterplot is one of three views which can be created in the LinkedView application.
The scatterplot is a fairly simple component. Clicking and dragging will select the genes within the rectangle. Holding down Control will allow you to select multiple disjoint sets of genes. Moving the mouse around will tell you the X and Y coordinates of the mouse at any given point.
To create a scatterplot, select "Analysis->Create Scatterplot..." from the menubar. You will then be confronted with the dialog in Figure 2.12, “Creating a Scatterplot”. The two pulldown menus determine what will be plotted on each axis. There options include the various arrays, the actual row number of the gene (called INDEX), and any annotation columns.

